
In a previous post we have learned how you can use the create-graph-connector project to speed up the development of a custom Graph Connectors. In that post, we have also briefly covered Dev Proxy, an open-source tool from Microsoft that you can use to better test your APIs. Thanks to Dev Proxy, you can intercept API calls, simulate API errors or throttling, mock responses so that you can test your code without needing the real APIs, and much more. In this post, we’ll focus on a specific feature of Dev Proxy that saved my life a few times while I was developing custom Graph Connectors: the ability to intercept and inspect requests and responses.
Configuring DevProxy
Dev Proxy is configured through a JSON file called devproxyrc.json. This file is used to define the rules that Dev Proxy will use to intercept the requests, the plugins you want to turn on, if you want to enable the logic to test failures or throttling, etc. Since you might want to use Dev Proxy with different projects, each of them with its own configuration, the tool supports two ways to define it:
- A global devproxyrc.json file, which is stored in the %LOCALAPPDATA%\Programs\Dev Proxy folder.
- A local devproxyrc.json file, which you can store in any folder of your project (e.g., the root folder of your project).
When you open the terminal and you type devproxy, the tool will automatically pick the “closest” one: if you are in a folder that contains a devproxyrc.json file, it will use that one; otherwise, it will use the global one.
The project that is created with the create-graph-connector tool is a great starting point, because it already includes a devproxyrc.json file configured to intercept requests against the Microsoft Graph. If you take a look, in fact, you will find the following urlsToWatch section:
|
|
This list cover all the possible endpoints of the Microsoft Graph, including the beta, US Government and the China ones.
As such, the easiest way to start using Dev Proxy to test your custom Graph Connector is either to copy this section into your configuration file or to grab a copy the entire devproxyrc.json from a Graph Connector sample project (like this one) and copy it into your own. In the second scenario, however, there’s a slight change we must make. If you take a look at the list of enabled plugins, you will find the following entry:
|
|
And, a bit below, the following configuration section:
|
|
Dev Proxy supports the concept of plugins: instead of making the tool too complex, by supporting all the possible scenarios, Dev Proxy itself is able only to intercept API requests. Any other feature is delegated to a plugin. In this case, the default Graph Connector project is configured to use the GraphMockResponsePlugin, which is a plugin that allows you to mock the responses of the Microsoft Graph. The configuration section graphConnectorMocks is used to define the path to the file that contains the mocks. In the default configuration, this file is stored in the .devproxy folder of the project.
However, for our scenario, we don’t need to mock the responses: we want to interact with the real Microsoft Graph APIs, but we want to intercept the requests and responses to understand what’s going on. As such, we can remove the GraphMockResponsePlugin from the list of enabled plugins or you can just set the enabled property to false.
Adding the DevTools plugin
NOTE: As of the time of writing (13th August 2024), the DevTools plugin included in the latest Dev Proxy stable version (0.19.1) contains a bug that will likely prevent it from working properly on Windows. If you need to use this feature right now, you will need to use as minimum Dev Proxy 0.20.0, which is available in the Beta channel or on GitHub. Once 0.20.0 will move to the stable channel, you won’t need to use this workaround anymore.
When I started to work on my Graph Connector + .NET Aspire project (a sample micro-services architecture to create and deploy a custom Graph Connector), I started to hit immediately an issue. If you remember what we have learned in the previous posts, creating a custom connector involves three operations with the Microsoft Graph:
- Create a connection
- Define the schema
- Upload the external items
In my case, I was already stuck with the first operation, due to an error I never encountered before. The request was failing because the body of the request (which means the configuration of the connection) was malformed. Since I was using the Microsoft Graph .NET SDK (which wraps for me all the HTTP requests), I wasn’t really sure what was going on, since the exception details weren’t provided many insights.
Please welcome the DevTools plugin, which enables you to combine Dev Proxy with the DevTools included in all the Chromium-based browsers, like Edge or Chrome. Thanks to this plugin, you can inspect all the requests and responses captured by DevProxy directly in the browser, by using the Network tool. Let’s see how to set this up.
As first step, you must enable the plugin, by adding the following entry in your configuration file, inside the plugins section:
|
|
Second, you must add a new configuration section, called devTools, where you can define which browser you want to use to inspect the requests:
|
|
The supported options are:
Edge(if you’re using the stable version of Edge)EdgeDev(if you’re using the Dev channel of Edge)EdgeBeta(if you’re using the Beta channel of Edge)Chrome
That’s it!
Using Dev Proxy with the DevTools plugin
Now you just need to open a terminal and type devproxy. If you have made the configuration changes in a specific file in your project instead of using the global configuration file, remember to start it from the same folder where your custom devproxyrc.json file is stored.
When you launch it for the first time, you might notice the following error:
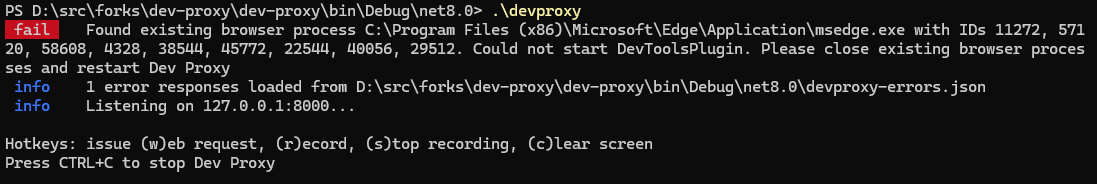
This error happens when an instance of the browser is already running, so you will need to close it before Dev Proxy can launch the DevTools. This is required because, in some operating systems and scenarios, opening up a new instance of the browser when there’s already one running will lead to the DevTools not starting up properly. This error is very common, especially if you’re using Edge on Windows. The browser engine, in fact, is used to power up many experiences, so it’s very likely that you will have multiple instances already running (you can see how, in the image, the list of process IDs is quite long).
If you want to kill all the instances easily, on Windows you can just open a PowerShell terminal and run the following command:
|
|
If you’re on MacOS, instead, you can use the killall command:
|
|
If you’re using Chrome, just replace msedge with chrome.
Once you have terminated all the instances, you can run devproxy again. This time, you should see your favorite browser starting up with the DevTools already opened. Now click on the Network tab and start to interact with your custom Graph Connector. For example, if you’re using a project created with create-graph-connector, you can try to create a connection by using the following command:
|
|
You will see all the requests and responses captured by Dev Proxy, and you can inspect them to understand what’s going on:
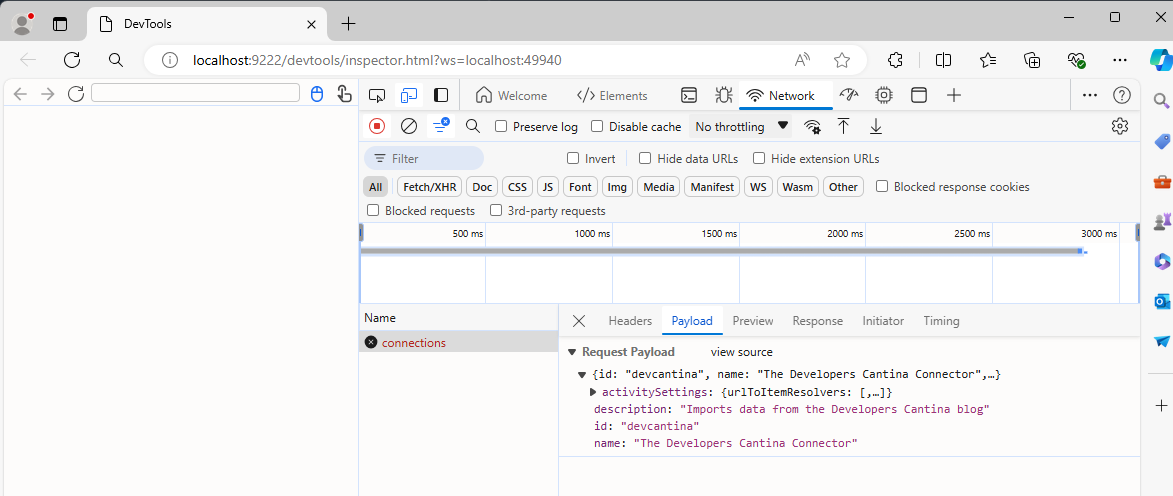
In the Payload section, you can see the exact JSON that has been sent to the API. In the Response section, instead, you can see the response, which includes detailed information about any error that might have happened. In my case, for example, thanks to this tool, I was able to find out that the ID I was using for the connector wasn’t valid, and that’s why the request was failing as malformed.
Wrapping up
In this post, we have seen how you can use DevProxy to intercept and inspect the requests and responses of your custom Graph Connector. Thanks to the DevTools plugin, you can actually see the network request details, giving you the ability to see exactly the JSON that is sent to the Microsoft Graph and the response that is returned back. This is super useful when you’re developing a custom Graph Connector, especially if you aren’t calling the APIs manually but you’re using a wrapper like the Microsoft Graph SDK for .NET or TypeScript, which tends to hide the inner communication with the Microsoft Graph.
If you want to test what we have learned in this post and you don’t have a custom Graph Connector, you can reuse the following sample I’ve published on GitHub, which ingests into the tenant the posts published on this blog.
Happy coding!!